A fierce competition is underway at stadiums and arenas to be seen as the sustainable cup of choice. A new life-cycle analysis could help clear things up.
Update, August 4, 2021: Upstream today released the final results of the study referenced below, concluding that “Single-use aluminum cups are the worst option for the climate by far.… Single-use aluminum cups are not a sustainable option when compared to other single-use cups or reusable cups, even if most of the aluminum cups are collected for recycling.”
* * * * *
There’s good news and bad news when it comes to beverage cups used at concerts, sporting events and other large gatherings: A fierce competition is underway to be seen as the sustainable container of choice, with each cup vendor making its own claims of environmental superiority. Obviously, they can’t all be best.
In many respects, this is a great competition to have. Reusable cups, barely a blip two years ago, are catching on in public venues. What was once almost unheard of — beer, cocktail and soda cups at ballgames or rock concerts, each undergoing multiple use cycles — is gaining momentum. As arenas and stadiums reopen post-pandemic, several are embracing a new environmental ethic, including promoting both recycling and reuse, with those ubiquitous 16-ounce cups near the top of most lists.
But are reusable cups, designed to be washed and transported multiple times, actually better than the recyclable versions?
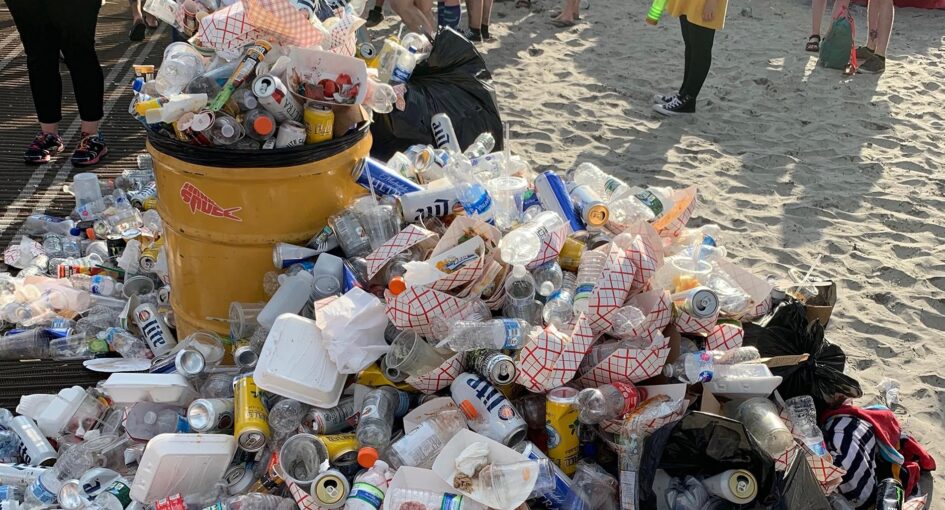
This is no mere bar bet. Billions of single-use cups are left on the ground or placed in trash bins at concerts and sporting events each year. Even where waste-collection bins exist, most people don’t hit the right ones, if they bother at all. Moreover, many recyclable cups are stuffed with other trash — food wrappers, half-eaten hotdogs, who knows what — making them difficult if not impossible to recycle in large quantities.
A fierce competition is underway to be seen as the sustainable container of choice. Obviously, they can’t all be best.
For years, the plastics industry pushed the recycling of single-use plastic cups as the greenest choice. More recently, compostable bioplastic cups became popular at many venues. But both formats have seen lackluster results, with the vast majority still ending up in landfills, incinerators or the environment.
Now, two new choices are vying for a front-row seat: single-use aluminum cups that claim to be infinitely recyclable; and reusable plastic cups that claim to contribute to a circular economy.
So, how do they fare?
A soon-to-be published life-cycle analysis (LCA), conducted by University of St. Thomas engineering professor John Wentz and some grad students, landed in my inbox last week, the first apples-to-apples assessment of the cups in use. The research was funded by Upstream, a nonprofit group that helps policymakers, businesses and others accelerate waste-reduction strategies.
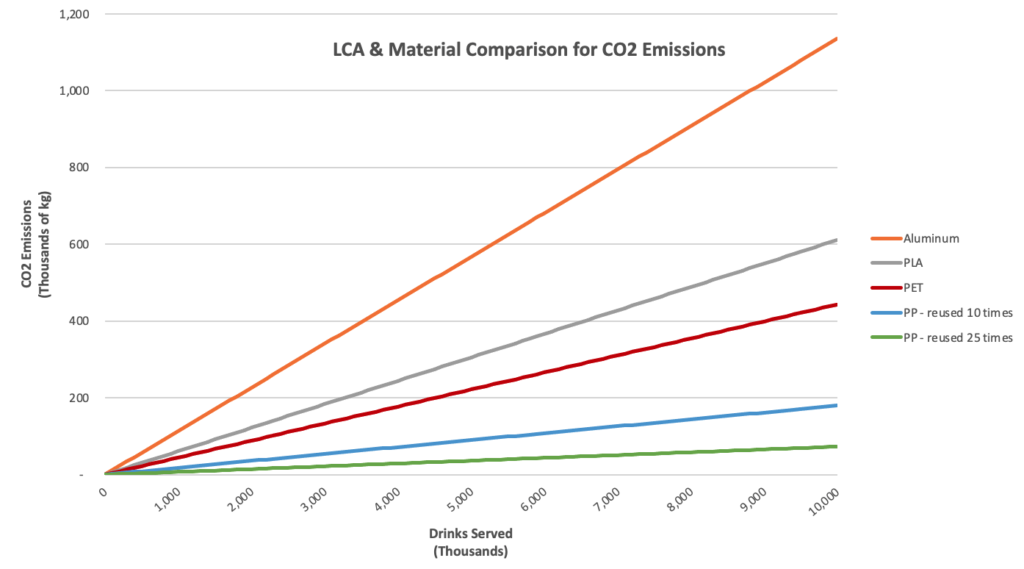
Source: Arena Event Beverage Cup Life-Cycle Analysis and Material Comparison, John Wentz, Ph.D. University of St. Thomas
The topline findings show that reusable cups, whatever the material, trump single-use recyclable cups, plain and simple. That may be intuitively obvious, especially when one recalls that the “3Rs” we all learned about — Reduce, Reuse, Recycle — is a hierarchy. In this case: Use the fewest possible cups, reuse them as much as you can and recycle only what’s no longer of service. (Landfilling, in the 3Rs, is not an option.)
Before I go further, I have a couple of conflicts here. In 2019, my wife and I made a small investment in a startup called r.Cup, which produces reusable polypropylene cups for large venues along with a turnkey cup washing and logistics service. And Ball Corp., the largest purveyor of single-use aluminum cups, has a longstanding relationship with GreenBiz Group, including as a sponsor of next week’s Circularity 21 conference, where one of its execs will be speaking.
Both companies’ types of cups are assessed in the LCA. In this article, I am simply sharing the findings without drawing any conclusions not contained in the actual report.
There’s a lot to drink in here, but let’s start with some context.
Impacts and tradeoffs
If you’re a student of life-cycle analyses, you already know they can be frustrating. They rarely draw a hard and fast conclusion. Rather, they employ a methodology to assess one or more products or materials, then conduct an analysis against that methodology.
The findings typically come in the form of data showing various impacts, which you can use to make decisions based on your specific interests or needs. If you’re optimizing for reducing greenhouse gas emissions, for example, you might make one kind of decision. If you’re optimizing for water efficiency, waste reduction, toxics reduction or other factors, you might make entirely different decisions based on LCA data. In most cases, users aim to balance several, sometimes competing, factors.
In this case, Wentz and his team set out “to provide unbiased information about energy-use requirements and carbon dioxide emissions that accompany the use of different beverage containers so that venue managers and other industry leaders can identify the most environmentally friendly approach.”
In other words: the climate impact of cups.
The analysis was designed around circumstances “where a performing art group travels from city to city on a multi-stop tour.” The venues analyzed ranged from 8,000 to 60,000 seats. The results would likely apply as well to sporting events and other large gatherings such as conventions, state fairs and music festivals.
The five types of containers analyzed were three single-use cups made of polyethylene terephthalate (PET), polylactic acid (PLA) and aluminum, and two reusable versions made of polypropylene and stainless steel. Each was assessed for energy consumption, carbon dioxide emissions, air acidification, water eutrophication and landfill impact.
Among the assumptions: The cups are manufactured in China and shipped by ocean to Los Angeles, then trucked to various venues across the United States; 100 percent of the reusable cups are recovered after each event and washed in industrial conveyor dishwashers at facilities 10 miles from the venues. The analysis also assumed that 100 percent of the PET and aluminum cups are recovered and recycled after each event. (The 100 percent recovery rate assumes any cups not collected at the venues are taken home and eventually recycled.)
Finally, the analysis looked at several scenarios for the reusable cups, where each was reused two, three, four, five and 50 times.
Big ‘ifs’
The findings, in a nutshell:
A reusable polypropylene cup has the lowest impact compared to a single-use cup “if it can be used at least six times in optimal recycling and five times at current rates.” A reusable stainless-steel cup has the next-lowest impact under those same conditions.
Among single-use cups, PET had the lowest energy consumption and greenhouse gas emissions.
Aluminum cups fared worst, using 47 percent more energy over their life-cycle and creating 86 percent more greenhouse gas emissions than other single-use options.
There are some big “ifs” here. First and foremost is the assumption that 100 percent of the cups are recovered for either washing and reuse (polypropylene and stainless steel) or recycling (PET and aluminum). PLA cups are designed for industrial composting facilities, which are relatively few and far between, so their recovery rate was not factored in.
As you might imagine, the real-world evidence is somewhat less ideal. At live events, unless labor-intensive hand-sorting is done, the recycling rate for single-use cups is anywhere from zero to 20 percent, according to Effect Partners, a sister company to rCup, whereas harvesting rates for reusable cups can be up to 95 percent, or even higher in some circumstances. The higher rate for reusables is due to a number of factors, including training venue staff, educating event attendees and more closely monitoring bins.
At live events, unless labor-intensive hand-sorting is done, the recycling rate for single-use cups is anywhere from 0 to 20%.
Of course, the infrastructure for both reuse and recycling is far from optimal, at least in the United States. It has become fashionable even in environmental circles to note that “recycling is broken,” and the facts bear that out. According to a recent report commissioned by Ball Corp., the recycling rate for aluminum is below 25 percent in 31 states and for PET in 35 states.
Also, there are limits to how much recycled content can go into some cups. While the Aluminum Association points out that “aluminum is 100 percent recyclable,” it also notes that “aluminum cans contain on average 73 percent recycled content,” meaning that each new container includes more than one-quarter virgin content. A few companies make PET and polypropylene cups using 100 percent recycled content, although it’s unclear whether any of these are used in the venues studied in the LCA.
As for reuse, relatively few cup-washing facilities exist, although they are starting to sprout up around the United States. The biggest challenge for reusables is that the cost per cup is more than for disposables due to the labor, transportation and sanitization required for a comprehensive reuse system.
So, what’s the bottom line?
It’s unlikely that this LCA will curb companies’ claims of environmental superiority, but it should give more scientific rigor for venue operators to assess those claims and to better understand the various options and their impacts.
As such, it could clear up the confusion that has led to inertia by many venue operators — and help more of them join the circular economy.